What if I told you that you can’t trust your freezer.
Or your refrigerator.
And even your high-end, medical-grade equipment may be unable to meet the manufacturer’s specifications.
Those are the findings from a recent research report that highlights the challenges of healthcare and life science professionals when trusting controlled substances in temperature-sensitive environments.
In a recent temperature monitoring study in Australia, only 32% of refrigerators maintained temperatures within the target 2–8°C range, while 44% reached temperatures above 8°C and 14.7% reached critically low temperatures below 0°C, meaning two-thirds of refrigerators exhibited cold chain excursions.
The problem is not that breaches happen. The problem is that most organizations collect this data yet have no systematic framework to interpret what it means for product integrity, compliance status, or regulatory defense.
This is a real problem facing countless professionals charged with product quality.
You can have perfect monitoring hardware and still fail an audit if you cannot explain what your data tells you about product safety.
But this does not mean you’re defenseless against temperature challenges.
Interpreting cold chain testing and monitoring data is not a nice-to-have skill; it is essential compliance infrastructure.
When a surveyor asks why you released a product after a documented excursion, “the monitor said it was okay” is not an answer. We believe you need calibration records, spatial context, decision documentation, and stability evidence that together form an audit-ready narrative.
JRI has more than a century of experience delivering this mission-critical technology to drive better decision-making and organizational outcomes that any serious healthcare or life science professional can stand behind.
Why Most Organizations Collect Data but Cannot Defend Their Compliance Decisions
The gap between data collection and data interpretation is where compliance programs collapse.
You log temperatures every fifteen minutes.
You get alerts when thresholds breach.
But when an excursion occurs, can you confidently determine whether the product remains safe? Can you document that determination in a way that survives regulatory scrutiny?
Most cannot.
A 2025 peer-reviewed study on the stability of refrigerated medications found that 17% of refrigerated pharmaceutical products evaluated lacked any retrievable temperature excursion stability data, even after direct inquiry to manufacturers, leaving healthcare providers unable to make evidence-based decisions when cold chain breaches occur.
JRI and TMI boast decades of experience in helping complex, regulatory-driven organizations both monitor and respond to temperature breaches, and we have developed and support one of the most technically sophisticated systems available in the market.
Without manufacturer stability data, your temperature log becomes a liability document rather than a decision tool. You know something went wrong, but you have no framework to assess impact or justify your next move.
This scenario is where unified monitoring infrastructure makes the difference.
When calibration records, spatial mapping data, and continuous logs live in separate systems, interpretation becomes guesswork. When they live in one platform, you can trace an excursion from the alert back through calibration history and spatial context to build a defensible compliance narrative.
JRI’s MySirius platform was designed specifically for this: metrology-grade data collection that produces audit-ready evidence, not just temperature graphs.
The Four Data Categories Auditors Expect You to Interpret Fluently
Regulatory bodies do not care whether you have monitoring equipment. They care whether you can interpret what that equipment tells you about product safety and compliance status. That interpretation requires fluency in four distinct data types:
Continuous temperature logs show you the timeline: when did the excursion start, how long did it last, and what was the peak deviation? This is your baseline narrative, but it is not enough on its own. Without context, a log that shows an elevated temperature reading for 45 minutes tells you nothing about product impact.
Excursion event records capture the alarm history and response actions. Who acknowledged the alert? What corrective action was taken? When was the product evaluated? These records transform a temperature deviation from a data point into a documented incident with accountability and resolution. If your monitoring system does not automatically log these events with timestamps and user attribution, you are building compliance gaps into your process.
Calibration certificates prove your monitors were accurate when the excursion occurred. An uncalibrated monitor reading above target could mean the actual temperature was meaningfully lower or significantly higher than displayed. Without traceable calibration to NIST or ISO 17025 standards, your temperature data has no evidentiary weight. JRI’s Calibration Module handles this infrastructure internally: automated calibration workflows, certificate generation, and audit trails that tie every reading back to a documented accuracy baseline.
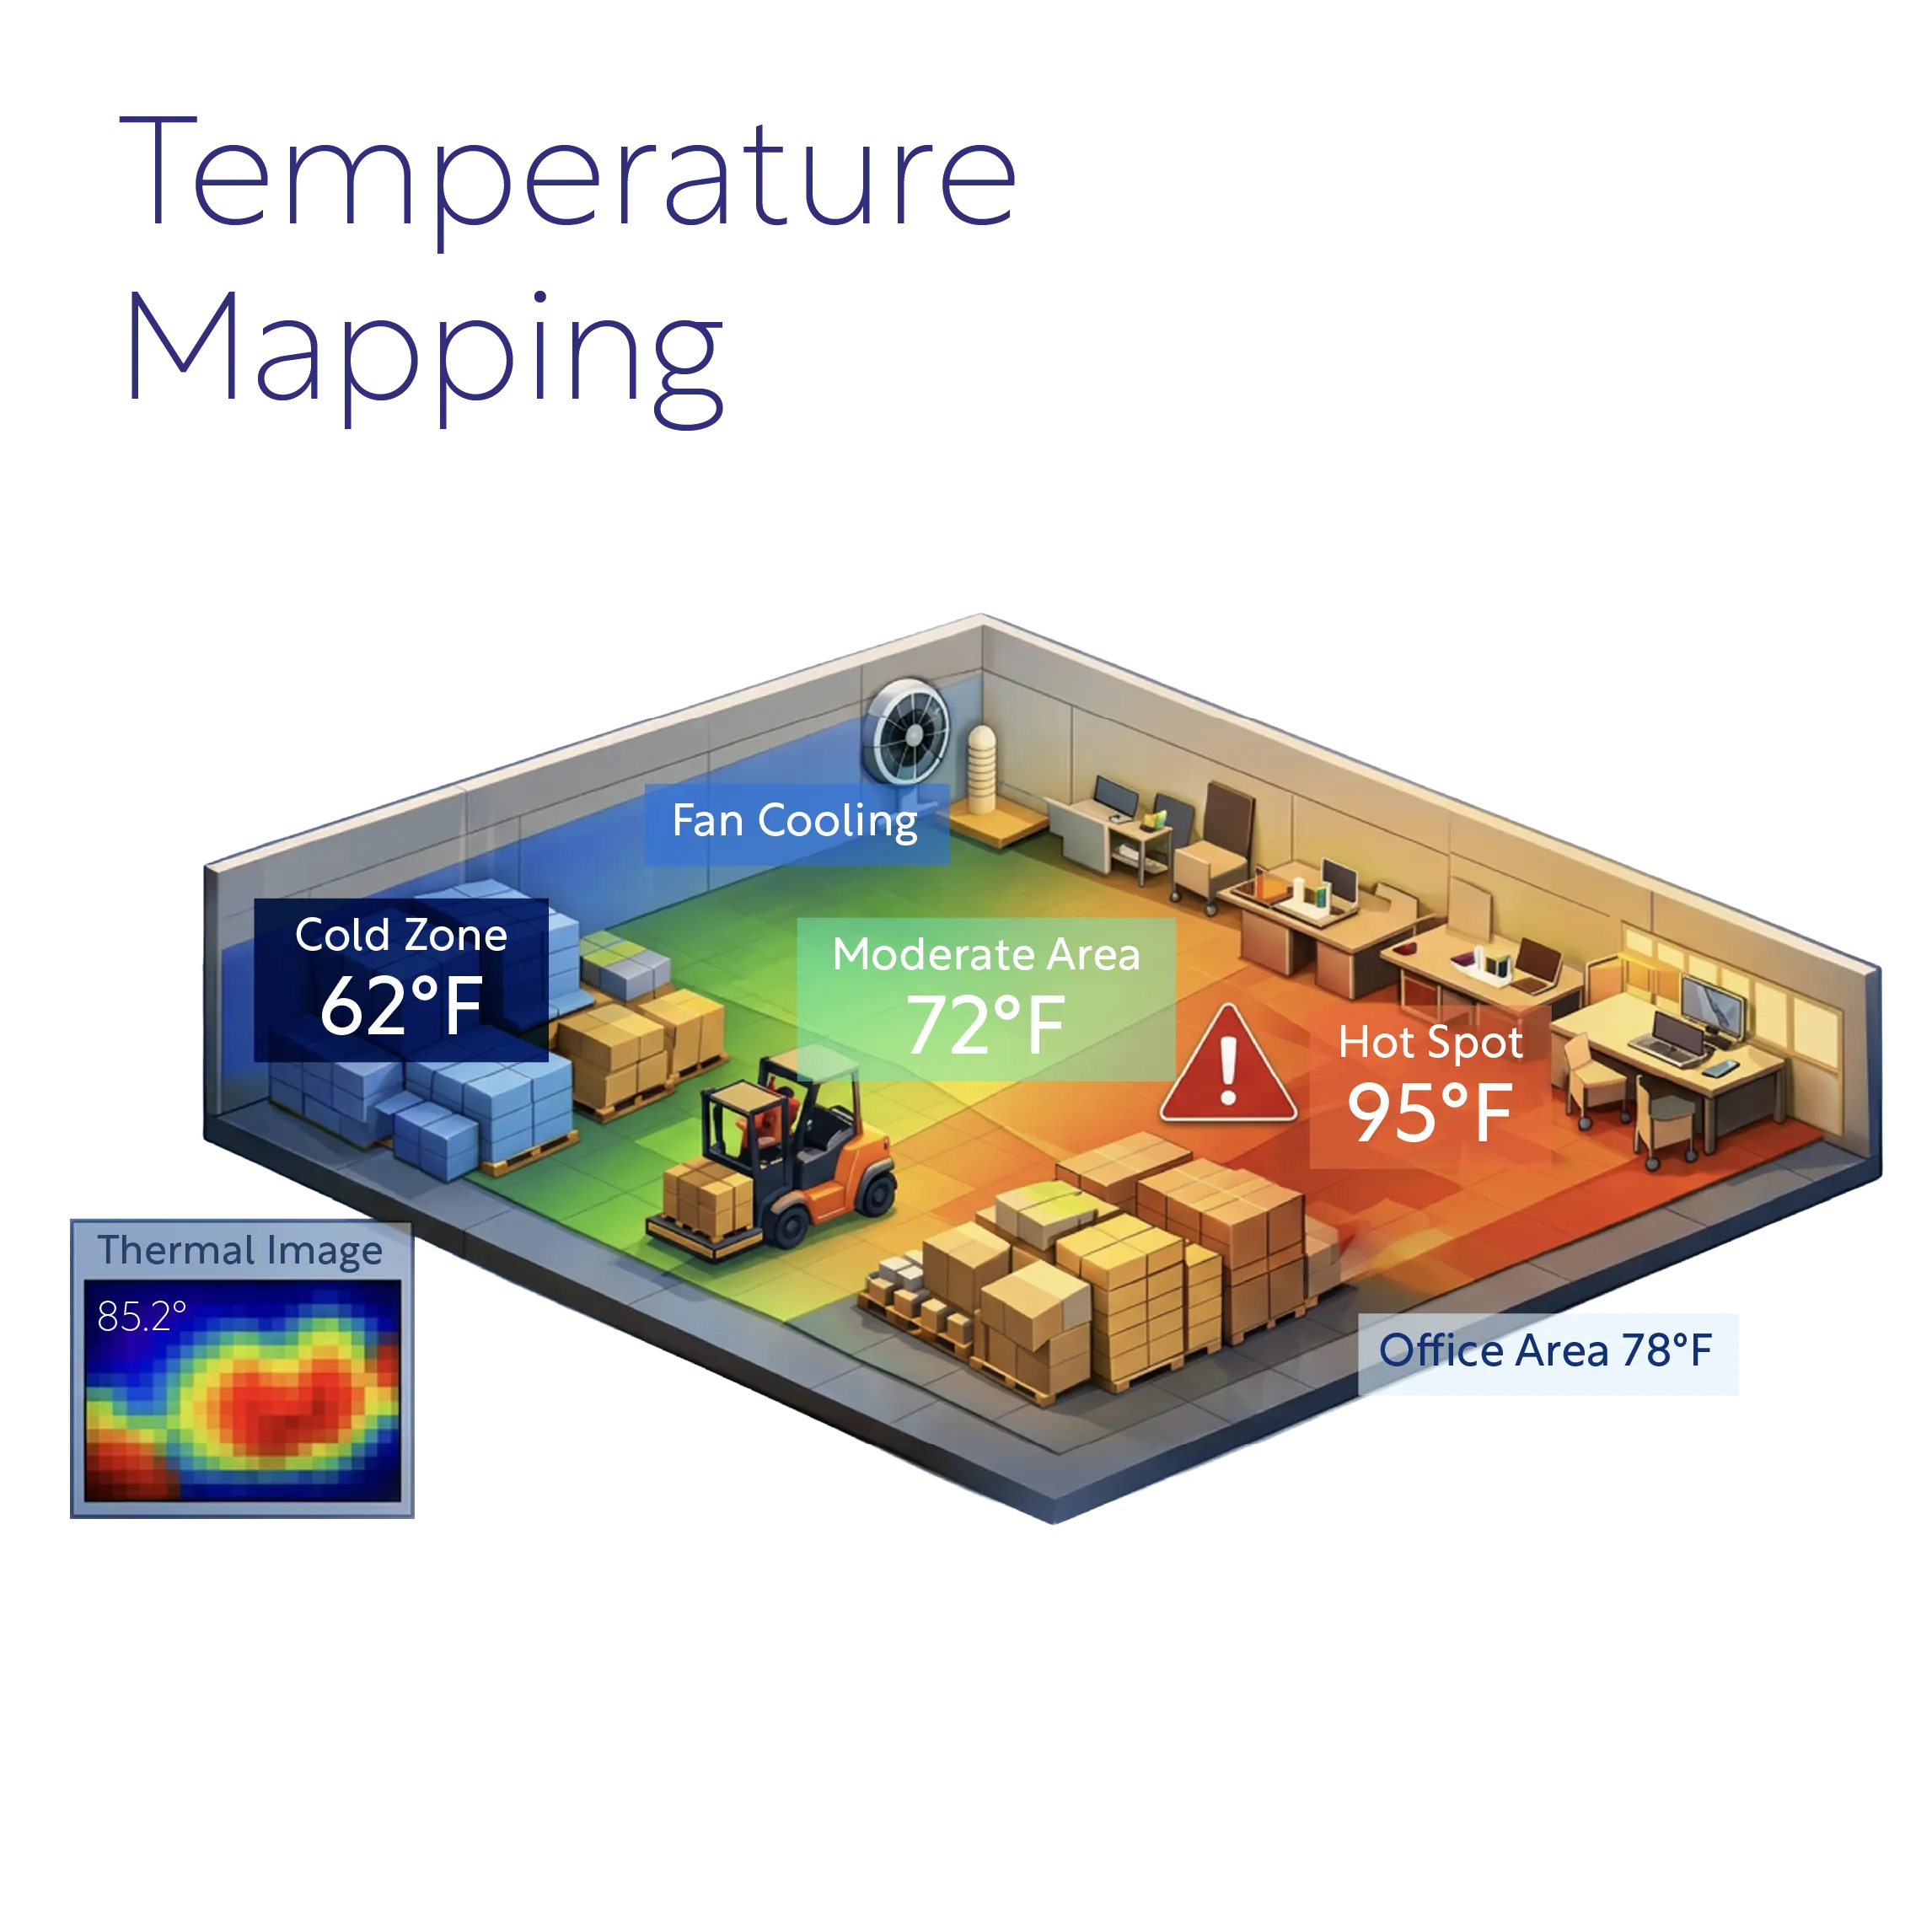
Spatial mapping data tells you whether the excursion was localized or facility-wide. A freezer that runs warm in one corner requires different corrective action than one that fails uniformly. Temperature mapping identifies those hot spots, validates your storage zones, and determines optimal monitor placement. JRI’s Temperature Mapping Module turns spatial intelligence into GxP-compliant qualification documentation that auditors recognize immediately.
When you can read all four data types together, you stop reacting to alarms and start managing compliance infrastructure.
Our Biosite case study demonstrates this shift: by consolidating transport and storage monitoring into MySirius Mobility, the laboratory simplified excursion analysis, reduced documentation errors, and turned fragmented data into a unified audit trail.
As Benoit Lancelin, Pharmacien Biologiste at Biosite, put it:
“We quickly found our feet in the JRI-MySirius application because it shares several similarities with the Labguard software. It is intuitive to use, and more of our technicians are connecting to it.”
Building a Decision Framework When Stability Data Does Not Exist
Here is the scenario that breaks most compliance programs: you have a documented excursion, the product is expensive, and the manufacturer has no retrievable stability data to tell you whether it is still safe.
Do you discard it and take the loss?
Do you release it and risk patient harm?
Do you quarantine it indefinitely while you wait for data that may never arrive?
You need a documented decision matrix before this scenario occurs, not during it.
That matrix should include
- excursion severity thresholds
- product risk classification
- required approvals for release-versus-discard decisions
- and documentation templates that capture your rationale
When inadequate training and awareness among handlers leads to preventable errors, contributing to an estimated $35 billion in annual global pharmaceutical losses from cold chain breakdowns, the difference between a defensible decision and a regulatory finding often comes down to whether you have a structured framework in place.
Calibrated monitoring data strengthens that framework significantly. JRI is one of the few monitoring technology providers that offers metrology as part of its monitoring package, allowing clients to self-calibrate their sensors from anywhere and enjoy greater confidence their system is monitoring accurately.
If your monitors are traceable to national standards and your excursion log shows exactly when and how far the temperature deviated, you can make a risk-based determination even without manufacturer stability data.
The decision tree is simple:
- Document the excursion parameters
- Reference your decision matrix
- Note the absence of stability data
- Justify your action based on the severity and duration of the breach.
That documentation may not be perfect, but it is defensible, and defensibility is what survives an audit.
JRI’s approach to this problem is infrastructure-level: metrology-grade accuracy built into the monitoring hardware, calibration workflows integrated into the platform, and data export formats designed for regulatory submission.
When you need to defend a compliance decision, you are not stitching together spreadsheets and PDFs from three different systems. You are pulling a unified audit trail that shows calibrated accuracy, documented response, and traceable decision-making from a single source.
Add to this alerts that can be delivered via text, email, push notification, and even phone call, as well as out-of-the-box reporting that can satisfy virtually any audit agency, and you have one of the most robust and intuitive monitoring systems available.
Reading Temperature Maps to Validate Storage Zones and Monitor Placement
Temperature mapping is not a one-time qualification exercise.
It is an ongoing compliance tool that tells you whether your storage environment performs the way your SOPs assume it does. A walk-in cooler that maps correctly in January may develop hot spots in July. A freezer that qualifies as empty may fail when fully loaded. If you are not interpreting spatial data seasonally and operationally, you are managing compliance based on outdated assumptions.
This is why staying connected to your monitoring data is crucial, and being familiar with seasonal and logistical trends can be the difference between passing and failing an FDA or Board of Pharmacy audit.
Effective mapping interpretation starts with hot spot identification:
Where in the facility does temperature deviate most from the target range?
Those locations determine monitor placement. If your coldest and warmest spots span a meaningful thermal gradient across the storage zone, putting your single monitor in the coldest location gives you false confidence. You need real-time monitoring for sensitive pharmaceutical products positioned where the risk is highest, not where the data looks best.
Seasonal variation analysis adds another layer.
Run mapping studies in summer and winter to capture the full thermal range your facility experiences. Document those variations and adjust your monitor placement or environmental controls accordingly.
When an auditor asks how you determined your current monitoring setup, “we mapped it once three years ago” is not a strong answer. They are looking for “We map seasonally, and here is the data that justifies our current configuration.” JRI and our partner TMI have the seasoned experts on hand who can guide you through this process with best practices deployed by some of the most sophisticated pharmaceutical and life science organizations.
JRI’s Temperature Mapping Module handles this complexity systematically with automated study workflows, multi-point data collection, 3D visualization, and compliance reporting templates that turn spatial intelligence into qualification documentation.
You are not manually plotting temperature gradients on graph paper. You are running GxP-compliant studies that produce audit-ready evidence of environmental control.
Turning Monitoring Data Into Audit-Ready Evidence That Justifies Your Compliance Decisions
The difference between a monitoring system and compliance infrastructure is documentation. Monitoring tells you what happened. Infrastructure tells you what happened, proves the accuracy of that record, explains what you did about it, and justifies why that action was appropriate.
That is what survives an FDA inspection.
When 91% of healthcare staff reported that they did not have the necessary tools to detect whether a vaccine had been damaged by a temperature excursion outside the recommended 2–8 °C range, the problem was not a lack of thermometers.
It was a lack of interpretive infrastructure:
- calibration records
- decision frameworks
- and documentation systems that connect data to defensible action.
JRI builds that infrastructure as a platform, not a collection of separate tools.
The compliance advantage is cumulative. Calibrated monitors produce legally defensible temperature records.
Spatial mapping validates your storage zones and monitor placement. Automated event logging captures response actions with timestamps and accountability. Export formats align with regulatory submission requirements.
When an auditor asks to see your cold chain documentation, you are not scrambling to compile evidence from multiple systems. You are generating a unified audit trail that demonstrates systematic control.
“Organizations that treat monitoring as compliance infrastructure rather than operational convenience build a category-level advantage. They interpret excursions faster, document decisions more defensibly, and justify their actions with data that regulators recognize as credible,” said Jim Lehr, Director, Business Development, JRI.
“That is not a marginal improvement in audit performance. That is the difference between passing and failing when the stakes are highest.”
If your current monitoring setup gives you temperature data but not compliance confidence, you are managing risk with half the infrastructure you need.
JRI builds the other half: metrology-grade accuracy, unified data interpretation, and audit-ready documentation that turns cold chain testing into defensible evidence. Learn more about how JRI’s monitoring solutions transform compliance infrastructure for regulated environments.